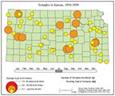
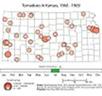
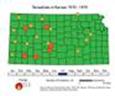
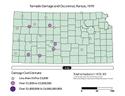
Animated Maps of Tornado Seasonality in Kansas, 1950-1995
The goal of this exercise was to create an
animated map of tornado seasonality in Kansas from 1950-1995.
Every student was assigned the different decade to visualize and were provided very
brief guidelines on the
design elements that must be included.
They were also provided with a simple HTML template from which to work.
The data for these maps were processed in ArcGIS
for Desktop 10.1.
They were rendered and exported from Adobe
Illustrator CS6 and animated using GIFMaker.me.
|
1950’s |
|||||||
|
Map |
Author |
|
Map |
Author |
|
Map |
Author |
|
|
Roxanne Alban |
|
|
Stephanie D'Anna |
|
|
Reid Landis |
|
|
Ashley Samonisky |
|
|
||||
|
1960’s |
|||||||
|
|
Zach Boyer |
|
|
William Eichhorn |
|
|
Charles Morrison |
|
|
Tyler Savoye |
|
|
Meghan Washington |
|
|
|
|
1970’s |
|||||||
|
|
John Buppert |
|
|
Kathryn Hickey |
|
|
Adam
Phipps-Dickerson |
|
|
Jeff Smith |
|
|
Tyler Wilson |
|
|
|
|
1980’s |
|||||||
|
|
Paul Byerly |
|
|
James Janis |
|
|
Kyle Redden |
|
|
Waverly Thompson |
|
|
Collin Woodyard |
|
|
|
|
1990’s |
|||||||
|
|
Matt Caddenhead |
|
|
Andrew Kratzmeier |
|
|
Matt Salkey |
|
|
Chris Truitt |
|
|
|
|
|
|


These maps were created by the students in
GEOG 320 (Cartographic Visualization)
during Fall 2014. Please note the individual pages for author credit.
Last Modified by Michael
Scott: 11DEC2014
Copyright © Michael Scott and Salisbury
University