Animated Maps of Florida Tornadoes, 1950-1995
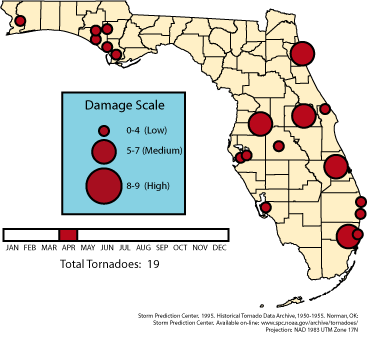
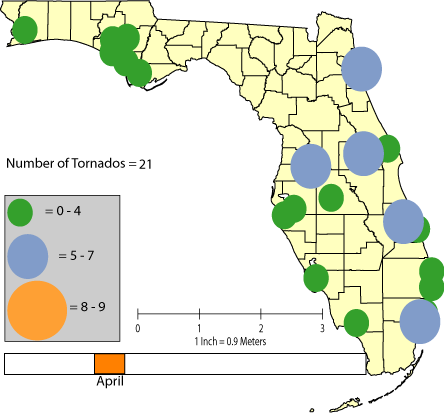
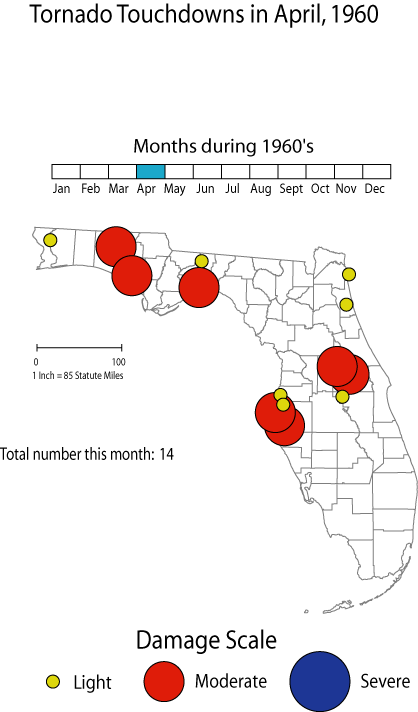
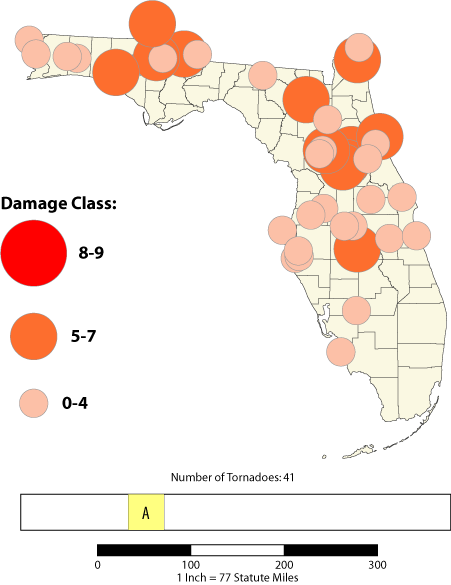
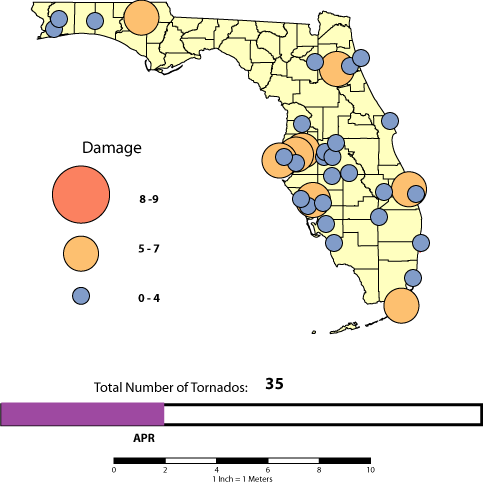
The goal of this exercise was to create an animated map of tornadoes in Florida
by month. Every student was assigned a decade of data, ranging from the 1950's to the 1990's.
Visitors can examine a map animation from each decade to examine the change in location,
frequency, and damage from tornadoes over the past half-century.
These maps were first created in Adobe's Illustrator 8.0 using Avenza's MaPublisher 3.5.
The Flash animations were created in Adobe's LiveMotion 1.0
| 1950 - 1959 | ||||
|---|---|---|---|---|
| Animation | Author | Animation | Author | |
 | Denise Baird | 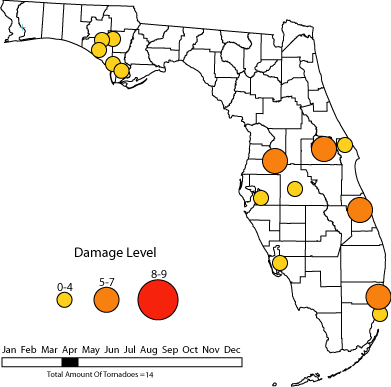 | Steve Heinrich | |
 | Mike Yowaiski | |||
| 1960 - 1969 | ||||
|---|---|---|---|---|
| Animation | Author | Animation | Author | |
 | David Bradford | 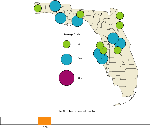 | David Long | |
| 1970 - 1979 | ||||
|---|---|---|---|---|
| Animation | Author | Animation | Author | |
 | Laurel Davis | 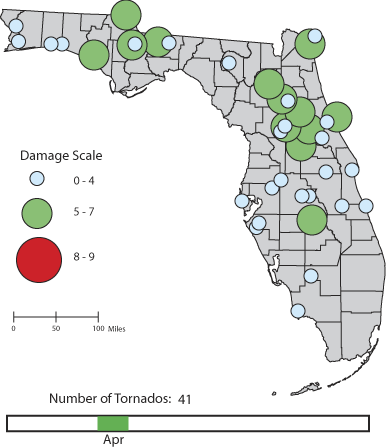 | Pat McLoughlin | |
| 1980 - 1989 | ||||
|---|---|---|---|---|
| Animation | Author | Animation | Author | |
 | Mark Dimmick | 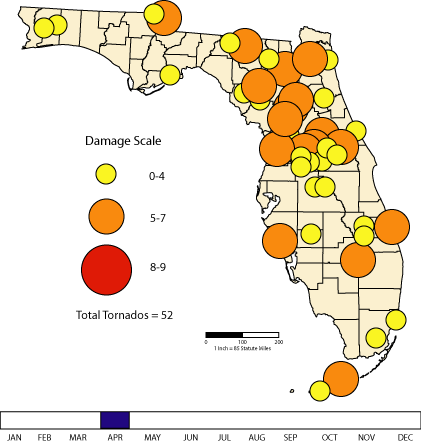 | Lauren Morres | |
| 1990 - 1995 | ||||
|---|---|---|---|---|
| Animation | Author | Animation | Author | |
 | Beth Fitzpatrick | 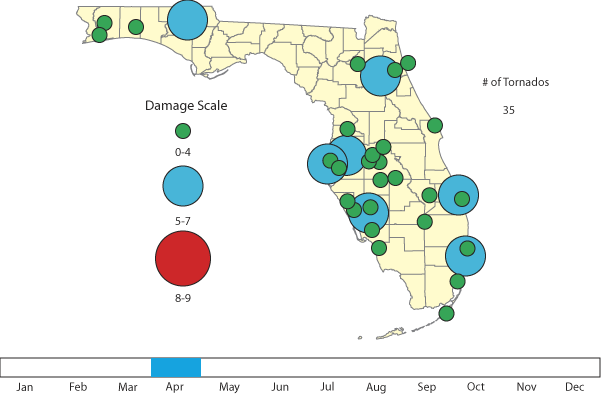 | Adam Tomko | |
These maps were created by the students in GEOG 320 (Cartographic Visualization)
during Spring 2003. Please note the individual pages for author credit.
Other Tornado Links:
Storm Prediction Center (Source of data for project)
Copyright © Michael Scott and Salisbury University