Chapter Eleven
Dissolved Oxygen Content and its Consequences on the Wicomico River
Jennifer Patro
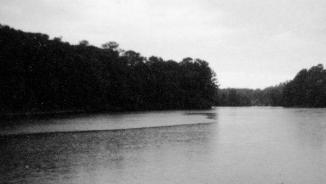
There used to be many popular places in Salisbury to cool off on a hot summer’s day, but now swimming only happens in the local pool at the YMCA. Poor water quality conditions throughout the Wicomico River have caused popular swimming holes such as Schumaker and Johnson Ponds to become no swimming areas. The local community seems to accept as a fact that swimming in the ponds of the Wicomico River will never happen again. Not only is there no swimming in these once popular areas, but also the overgrowth of aquatic plants has caused the river to look unpleasant in many places. People complain of the horrible smell emanating from the river and the cloudy look of the ponds. [1] The overgrowth of aquatic plants in some ponds makes fishing and boating nearly impossible, which deter people from visiting the ponds in the river altogether.
Photo Courtesy of
Jennifer Patro
Many different problems cause poor water quality such as heavy metals, fecal coliform, low pH, nutrients, low dissolved oxygen content, and sedimentation. I will highlight only one of the major troubles, which is low dissolved oxygen content. Although I am only describing the low dissolved oxygen content of the Wicomico River, you will see how the other forms of pollution are related to this problem. In order to understand the water quality problem at hand, I will have to define many terms and how to take steps to fix them.
The Causes of this Problem
Dissolved oxygen is the measurement of the amount of oxygen present in water, which is an obvious concern to the health of the Wicomico. [2] The state of Maryland frequently measures the dissolved oxygen content of streams and river in the state in order to make sure that aquatic life will be able to survive.
This chart shows the amount of
dissolved oxygen in MG/L that different aquatic species need to survive.
The species of fish that need these higher amounts of dissolved oxygen
are found in the Wicomico River.
[3]
A river with low dissolved oxygen does not have a pleasant appeal to it. There will be an overgrowth of algae on the top layers of the water that could make waterfront property, marsh-front property. On a warm day, the algae will decay and leave a stench that will not be pleasant to any nose. A river with large amounts of nutrients present which causes the over enrichment of aquatic life is called eutrophic. [4] These nutrients, low water flow, shallow water, and warm water temperatures help the growth of algae in the water. [5] As temperatures rise, the sun kills the top layers of the surface algae mats and they begin to decay. [6] The decay of the algae causes bacterial consumption of oxygen in the water, which lowers the dissolved oxygen content in the river. [7] Many areas of the Wicomico River have serious eutrophication problems, most of which are the located in the dammed up portions of the river that are now ponds because the conditions present favor algae growth.
While traveling down the river, one of the most noticeable things is the condition of the lawns of the people that live on the river. Fertilizers help the green and healthy appearance of the grasses. The way the lawns slope downhill toward the river allows the fertilizer, which contains nitrogen, to easily run off into the river. Nitrogen is one of the nutrients that catalyzes the growth of algae. Industry, agriculture, forests, and air pollution are all pathways for nitrogen to enter the river. [8] Nitrogen content is higher during low tide because of sediment movement, which releases ammonia. [9] Fertilizers and industry are the largest contributors of the nutrient nitrogen to the river. In 1997, Wicomico County dumped over 3,506 tons of nitrogen into the farm soils in the form of pesticides and fertilizers and 701 tons in Somerset County (the two counties surrounding the river). [10]
Although the main nutrient causing the overabundance of algae is nitrogen, phosphorous also lowers the amount of dissolved oxygen in the river. [11] Before 1975, phosphorous entered the river primarily by wastewater. On January 1, 1975, the Maryland Water Resources Administration reduced phosphorous content in wastewater to ninety-seven percent of its previous amount. [12] Much of the phosphorous entering the river came from laundry detergents until the federal government pressured companies to find alternatives to phosphates. [13] Today, the majority of phosphorous entering the river comes from mixed agriculture in the form of ortho-phosphate and organic phosphate. Organic phosphate is the dissolvable form and is more readily available for biological processes. [14]
The Environmental Protection Agency sets certain standards in order to limit the amount of nutrients in a body of water. The state of Maryland has the job of determining which bodies of water they feel do not meet proper water quality standards. These bodies of water are known as water quality limited segments and Maryland is required to set total maximum daily loads for the nutrients in these water quality limited segments. The total maximum daily loads are limits of a particular substance that a body of water can receive without violating water quality standards. [15] The State of Maryland bases the total maximum daily loads upon various equations such as the Vollenwieder Relationship and Carlson’s Trophic State Index. The State of Maryland sets the total maximum daily loads and then the Enviromental Protection Agancy approves them. [16]
There were 206 water quality limited segments named in 1998 by Maryland’s Department of the Environment. [17] Maryland named the Wicomico River a water quality segment as part of the Chesapeake Tributary Strategies and it is on the lowest priority listing for clean up. Maryland hopes that the total maximum daily loads set for the river will help restore the water quality.
Many efforts by other states and organizations have been made to lower the amount of nutrients that enter the Wicomico River. In 1983, the Chesapeake Bay Commission, consisting of Maryland, Pennsylvania, Virginia, Washington, D.C, and the United States Environmental Protection Agency joined to start the Chesapeake Bay Program. [18] These organizations agreed to meet two times a year in order to organize efforts to restore the bay. In 1987, this group developed the Chesapeake Bay Agreement, which set goals and objectives toward cleaning up the bay. They made deadlines to meet their goals in reducing discharge of poorly treated sewage and establishing and enforcing pollutant limits in compliance with water quality laws. [19] In 1992, the Chesapeake Bay Program amended the commitment to include the need to support the Bay’s tributaries. This plan established a deadline to develop specific strategies towards cleaning up the bay’s tributaries, which will help lower the amount of nutrients entering the Wicomico River. [20]
Even though it seems that nitrogen and phosphorous have only negative effects, both are important nutrients to the ecosystem of the Wicomico River. Nitrogen is important in the production of animal and plant tissues and phosphorous is crucial to the food system of the aquatic life. [21] The presence of these nutrients does not cause the problem in the river; however, the overabundance of these nutrients due to industry, forests, and agriculture creates a problem. [22]
Now we will begin our tour of the Wicomico River beginning with the North Prong, which includes the water quality limited segment, Johnson Pond. Then our trip will wander into the South Prong of the river, which is home to Schumaker Pond. Our journey will come to an end in the gateway to the Chesapeake Bay, the lower portion of the River.
The North Prong and Johnson Pond
The citizens of Salisbury used to enjoy a cool swim in Johnson pond while enjoying a picnic in the shade of the trees but now there are signs posted all over the shores of the pond that say “No Swimming Allowed.” Johnson Pond is located on the northern prong of the Wicomico River. Six streams drain into the pond: Connelly Mill Branch, Wood Creek, Leonard Pond Run, Brewington Branch, Middle Neck Branch, and Peggy Branch.
Citizens of Salisbury enjoying a swim in Johnson Pond. [23]
The state of Maryland placed the upper part of the Wicomico River on the water quality limited segment list as being impaired in 1996 because of a high sediment load and overabundance of phosphorous. [24] The total maximum daily loads that are set for Johnson Pond are intended to “assure that a minimum dissolved oxygen content of 5 mg/L is maintained in the well-mixed surface waters of Johnson Pond, resolve violations of narrative criteria associated with excess phosphorous enrichment of Johnson Pond, and resolve violations of narrative criteria associated with excess sedimentation of Johnson Pond by reducing sedimentation to a reasonable rate.” [25]
The upper portion of the river includes Johnson Pond and the streams that drain into it. Johnson Pond’s high sediment load has led to a reduction in its volume from 62.1 million cubic feet in 1933 to 41.4 million cubic feet in 2000. This has reduced the fishing habitat and obstructed the recreational use of the pond from boating and fishing. The overabundance of phosphorous leads to a lower amount of dissolved oxygen, which causes fish kills and foul odors that also interfere with the recreational use of the lake. [26] Wood Creek, which empties into Leonard Pond Run, is home to the Delmar Wastewater Treatment Plant, which the state of Maryland considers a major polluter of Johnson Pond. The other major polluter is the Perdue Wastewater Treatment Plant located on Zion Road that empties into Peggy Branch. The government considers these polluters point sources to Johnson Pond because they know how much nutrients these Wastewater Treatment Plants expel. The rest of the nutrients expelled into the water are from non-point sources because the government cannot pinpoint exactly where they came from. [27] In order for Johnson Pond to raise the amount of dissolved oxygen to a standard level (5 mg/L is the minimum level set by Maryland), a 39% reduction (and a 49% reduction from non-point sources) in the total amount of phosphorous that enters the pond will be necessary. [28]
Map of the tributaries of Johnson Pond. [29]
Agriculture is
the main cause of the poor water quality found in the upper portion of the
river. In 1997, Wicomico County
released 1,176 tons of phosphate into the ground in the form of pesticides and
when rain falls, only 51 percent of these nutrients enter the soil and the
rest runs off into the river.
[30]
,
[31]
Photo
of Johnson Pond courtesy of Jennifer Patro
The South Prong and Schumaker Pond
Recently, Schumaker Pond has become a concern for the residents that live in the surrounding neighborhood. An overabundance of aquatic plants has caused obstruction of recreational activities such as boating and fishing. The presence of the aquatic plants: hydrilla, filamentous algae, and spatterdock have caused the majority of the problems because of their ability to grow so aggressively. The filamentous algae and spatterdock are treatable with chelated copper compounds, however the exotic aquatic plant, hydrilla, is harder to get rid of. [32]
Drawing
of Hydrilla
[33]
Drawing of Spatterdock
[34]
Picture of Filamentous Algae
[35]
The hydrilla can also cause problems to Schumaker Pond by blocking sunlight from reaching the bottom of the pond. It is also much more efficient at taking up nutrients compared to other aquatic plant life. [36] Hydrilla is a good source of food for the area’s waterfowl, but can be detrimental to the health of the fish in the pond. [37]
This picture of Shumaker Pond shows the overgrowth of algae can be seen in the center of the pond. The water surface on the side of the pond has a different “texture” to it that can be clearly seen in this picture. Photo courtesy of Jennifer Patro
The residents’ desire to get rid of the hydrilla has caused them to consider the option of chemically treating the pond with fluridone, a systemic herbicide that will control the growth of the plant. [38] This chemical will help make Schumaker Pond very pleasing to the eye, crystal clear and odorless. The problem with the residents’ proposed solution is that chemicals such as fluridone and chelated copper compounds will not just kill the algae and hydrilla - it could harm other aquatic plants, fish, and life in the pond.
Fluridone is a chemical found in the aquatic pesticide, Sonar. States across the country applied this pesticide to many ponds and lakes in order to control the hydrilla but it takes several years and applications for any effect to take place. A typical treatment takes around 30-90 days to work and is at a concentration of 0.015-0.02 ppm. [39] Many aquatic plants besides the hydrilla are susceptible to Sonar. In order to minimize the impact of Sonar on the native species to the pond, it is best to treat during early spring, which is before active growth of aquatic vegetation.
The main problem with Sonar is the degradation of the chemical into monomethylformamide (MMF). MMF is a well-studied toxin that has negative effects on both humans and wildlife. About ten days after the release of Sonar from its pellet form into the pond, it will begin to degrade into MMF. MMF will not further degrade in the environment because it is a highly stable and soluble compound. Scientists have found that MMF has produced birth defects in test animals and is also known to cause liver toxicity in humans. The amount of MMF that causes these problems is thousands of times higher than the amount that the residents would release into Schumaker Pond. [40]
The proposed plans for Schumaker Pond are an attempt by residents to improve the look and quality of Schumaker Pond, but the Sonar will just cause more problems in to river. The only control of the chemical from floating down the river is the fact that Schumaker Pond does not contain a strong current to carry the Sonar downstream.
The amount of Sonar that Schumaker Pond would receive will be in such a low concentration that it should not cause harm to aquatic life. However, bioaccumulation of the MMF could lead to problems with wildlife. If a tadpole in the pond consumes a small amount of MMF, a fish eats thirty tadpoles, and then a bear eats thirty fish, the MMF will affect the bear with 60 times the amount.
The Lower Wicomico and the Oyster Business
The problem of water quality was not a noticable issue to the citizens of Salisbury until the mid-1960’s, when a decrease in the shellfish population, particularly oysters, started to draw attention to the river. [41] Oysters are bottom dwelling shellfish that pump water through tubes in their bodies. When there are chemicals present in the water and sediment, the oysters filter them through as well, causing harm to their systems, which can be fatal. [42] The city was doing studies in 1967 on the river to find out what was depleting the oyster population but there was “no fear, at this time, of closing the waters to oystering.” [43] Just one year later, though, the city placed a ban on oyster harvesting in the Wicomico River. The oyster harvesters sued the city because of the ban; they believed that the industries were at fault because they had been dumping raw sewage into the river and demanded that a sewage disposal plan be put into effect. [44]
Although the major decline in the oyster population was due to disease, the lack of dissolved oxygen in the river has hindered the development of oyster larvae. [45] Since the mid 1990’s, the state of Maryland has identified the lower part of the Wicomico River as having signs of eutrophication. [46] This part of the river drains into the Chesapeake Bay and is located from the center of Salisbury down to Monie Bay. Most of the land around the lower part of the river is forest (55%) while the other parts are urban areas (21%) or agricultural land (21%). The urban area is expanding into the forest and agricultural portions of the land around the watershed because of subdivisions replacing the cropland. [47]
The growing urban areas have led to the high amount of nutrients released by the wastewater treatment plants in the surrounding area. Studies done by the Maryland Department of the Environment on the Wicomico River have shown that wastewater treatment plants contribute enough nutrients to the water for Maryland to consider them point sources. In 1998, the Salisbury Waste Water Treatment Plant and the Fruitland Waste Water Treatment Plant contributed 103,489 pounds of nitrogen and 5,869 pounds of phosphorous. This is only 10% of the nitrogen and 11% of the total phosphorous that is expelled into the lower part of the river each year; the rest comes from non-point sources. These non-point sources include mixed agriculture (51%), urban (21%), and forests (14%) as the main contributors. [48]
The average annual total nitrogen load in the lower part of the river is 974,717 pounds per year and total phosphorous is 53,639 pounds per year. [49] This is slightly lower than the Total Maximum Daily Load set by the state of Maryland for nitrogen, which is 1,266,530 pounds per year of nitrogen while the amount of phosphorous, is about one-half the Total Maximum Daily Load at 103,480 pounds per year of phosphorous. [50] Even though the contributions of nutrients to the lower part of the river is below the set Maryland limit, as the Eastern Shore continues to grow, the total loads of nitrogen and phosphorous will soon reach their limit. The Environmental Protection Agency approves these limits in order to support and restore proper water quality to the Wicomico River. [51]
A Cure to the Problem
Traveling down the river, it is noticeable that many industries and highly fertilized lawns exist along the banks of the river between Salisbury and Upper Ferry. It is important for the citizens of Salisbury to be aware of their everyday actions affecting the water quality of the Wicomico. The decrease in the amount of forest around the watershed, the increase in agriculture, and the increase in developed land has contributed to the increase in runoff with higher levels of nutrients. [52] Planting trees will help block nutrient runoff, and setting limits on the usage of herbicides and pesticides by farmers is a way to decrease the amount of nutrients entering the river. The surrounding wastewater treatment plants will have to upgrade their systems to lower the abundance of nitrogen and phosphorous expelled into the river in order for nutrient amounts to decrease significantly.
It was not easy to find water quality information on the Wicomico River. There have not been many studies done before the mid-1990’s. This means that the Department of Natural Resources does not know the history of the dissolved oxygen content of the Wicomico. When testing the water, it is best to compare results to the years before to see if there are any increases or decreases in the amount of dissolved oxygen and nutrients in the water. Without having complete and through results from the past, it is hard to develop a plan for water quality improvement of the river. The Department of Natural Resources frequently tests the river now, in order to find out what parts of the river need improvement. It will take many years in order to improve the water quality of the river, just as it took many years to discover the poor water quality of the river.